Costs & Budget Tab
Get detailed financial data about your operations
The Costs & Budget tab offers detailed insights into your financial data, allowing self-service users to easily view and monitor the costs associated with billable operations on our platform. It simplifies expense tracking and management, offering greater control over your spending.
To access it, go to the Control Center and select the Costs & Budget tab in the collapsible left sidebar.
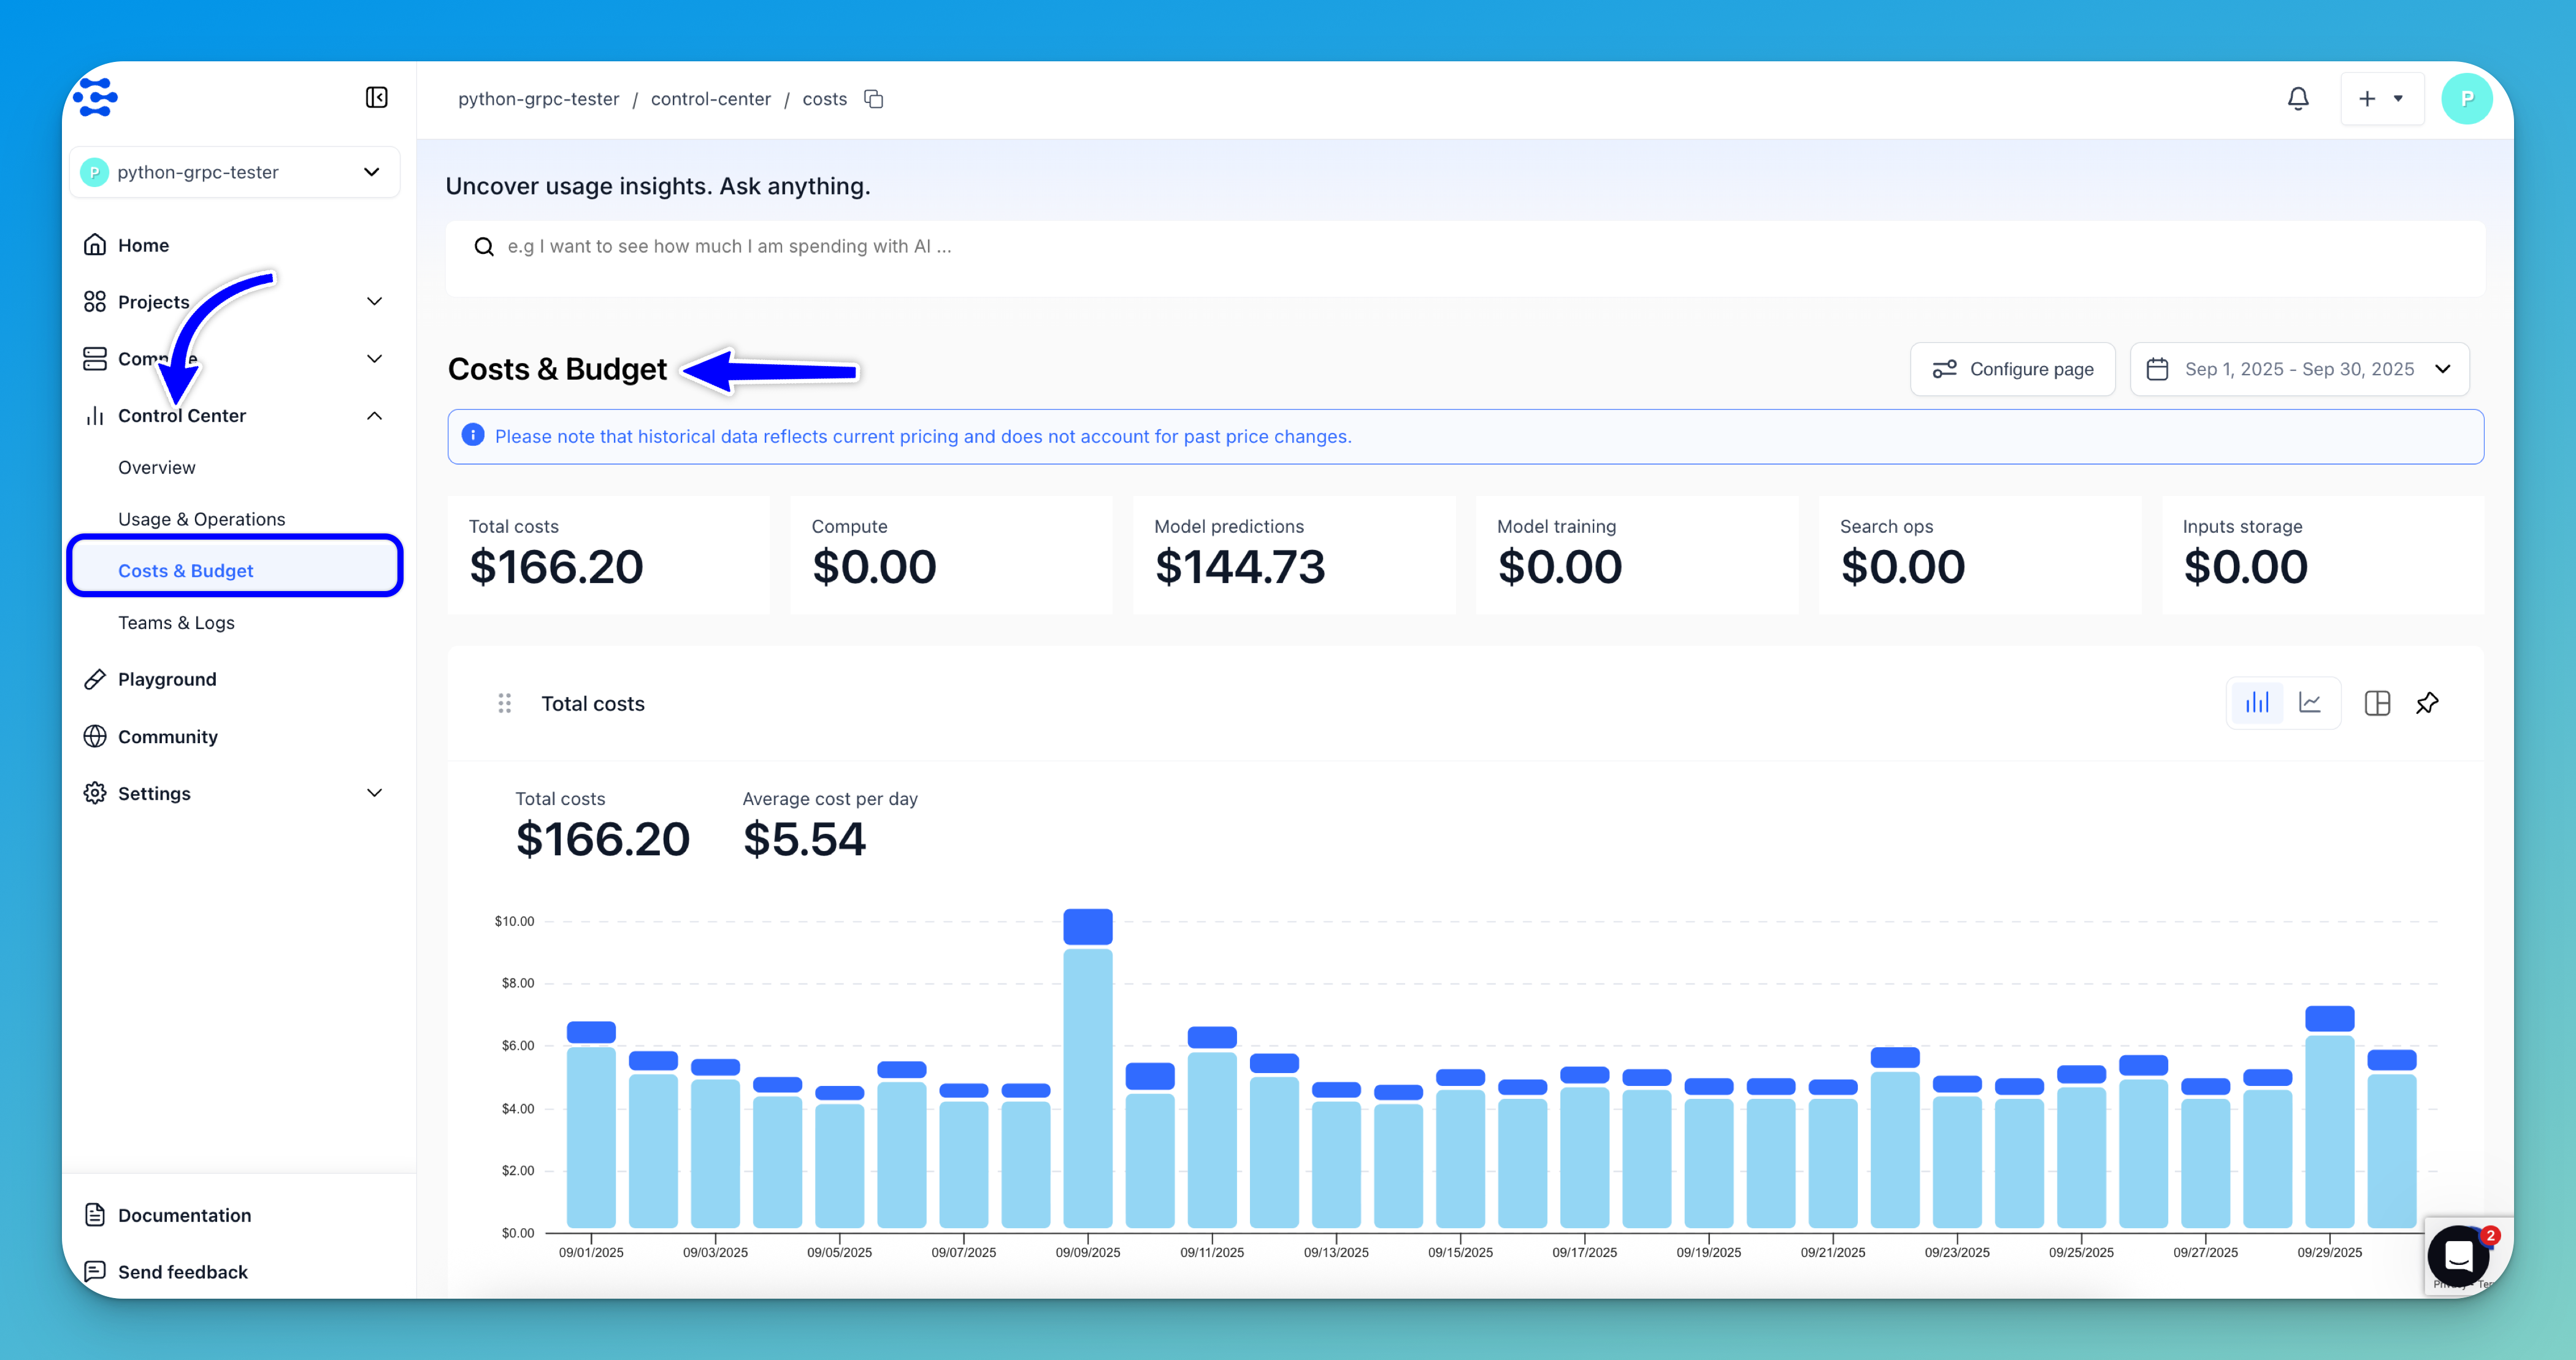
The overview section of the Costs & Budget page provides a quick analysis of your total expenses on the Clarifai platform for the selected time period.
It tells you:
- The total cost of all billable operations
- The total cost of Compute Orchestration tasks
- The total cost of model predictions
- The total cost of training models
- The total cost of search operations
- The total cost of storing inputs
Pricing for historical data is based on current rates, without accounting for any past price changes.
Common Chart Features
The Costs & Budget page has interactive charts that help you visualize your expenses on the Clarifai platform for the selected period.
Some of the key functionalities include the ability to drag charts, pin your favorites, switch between different chart types, and use tooltips for detailed insights.
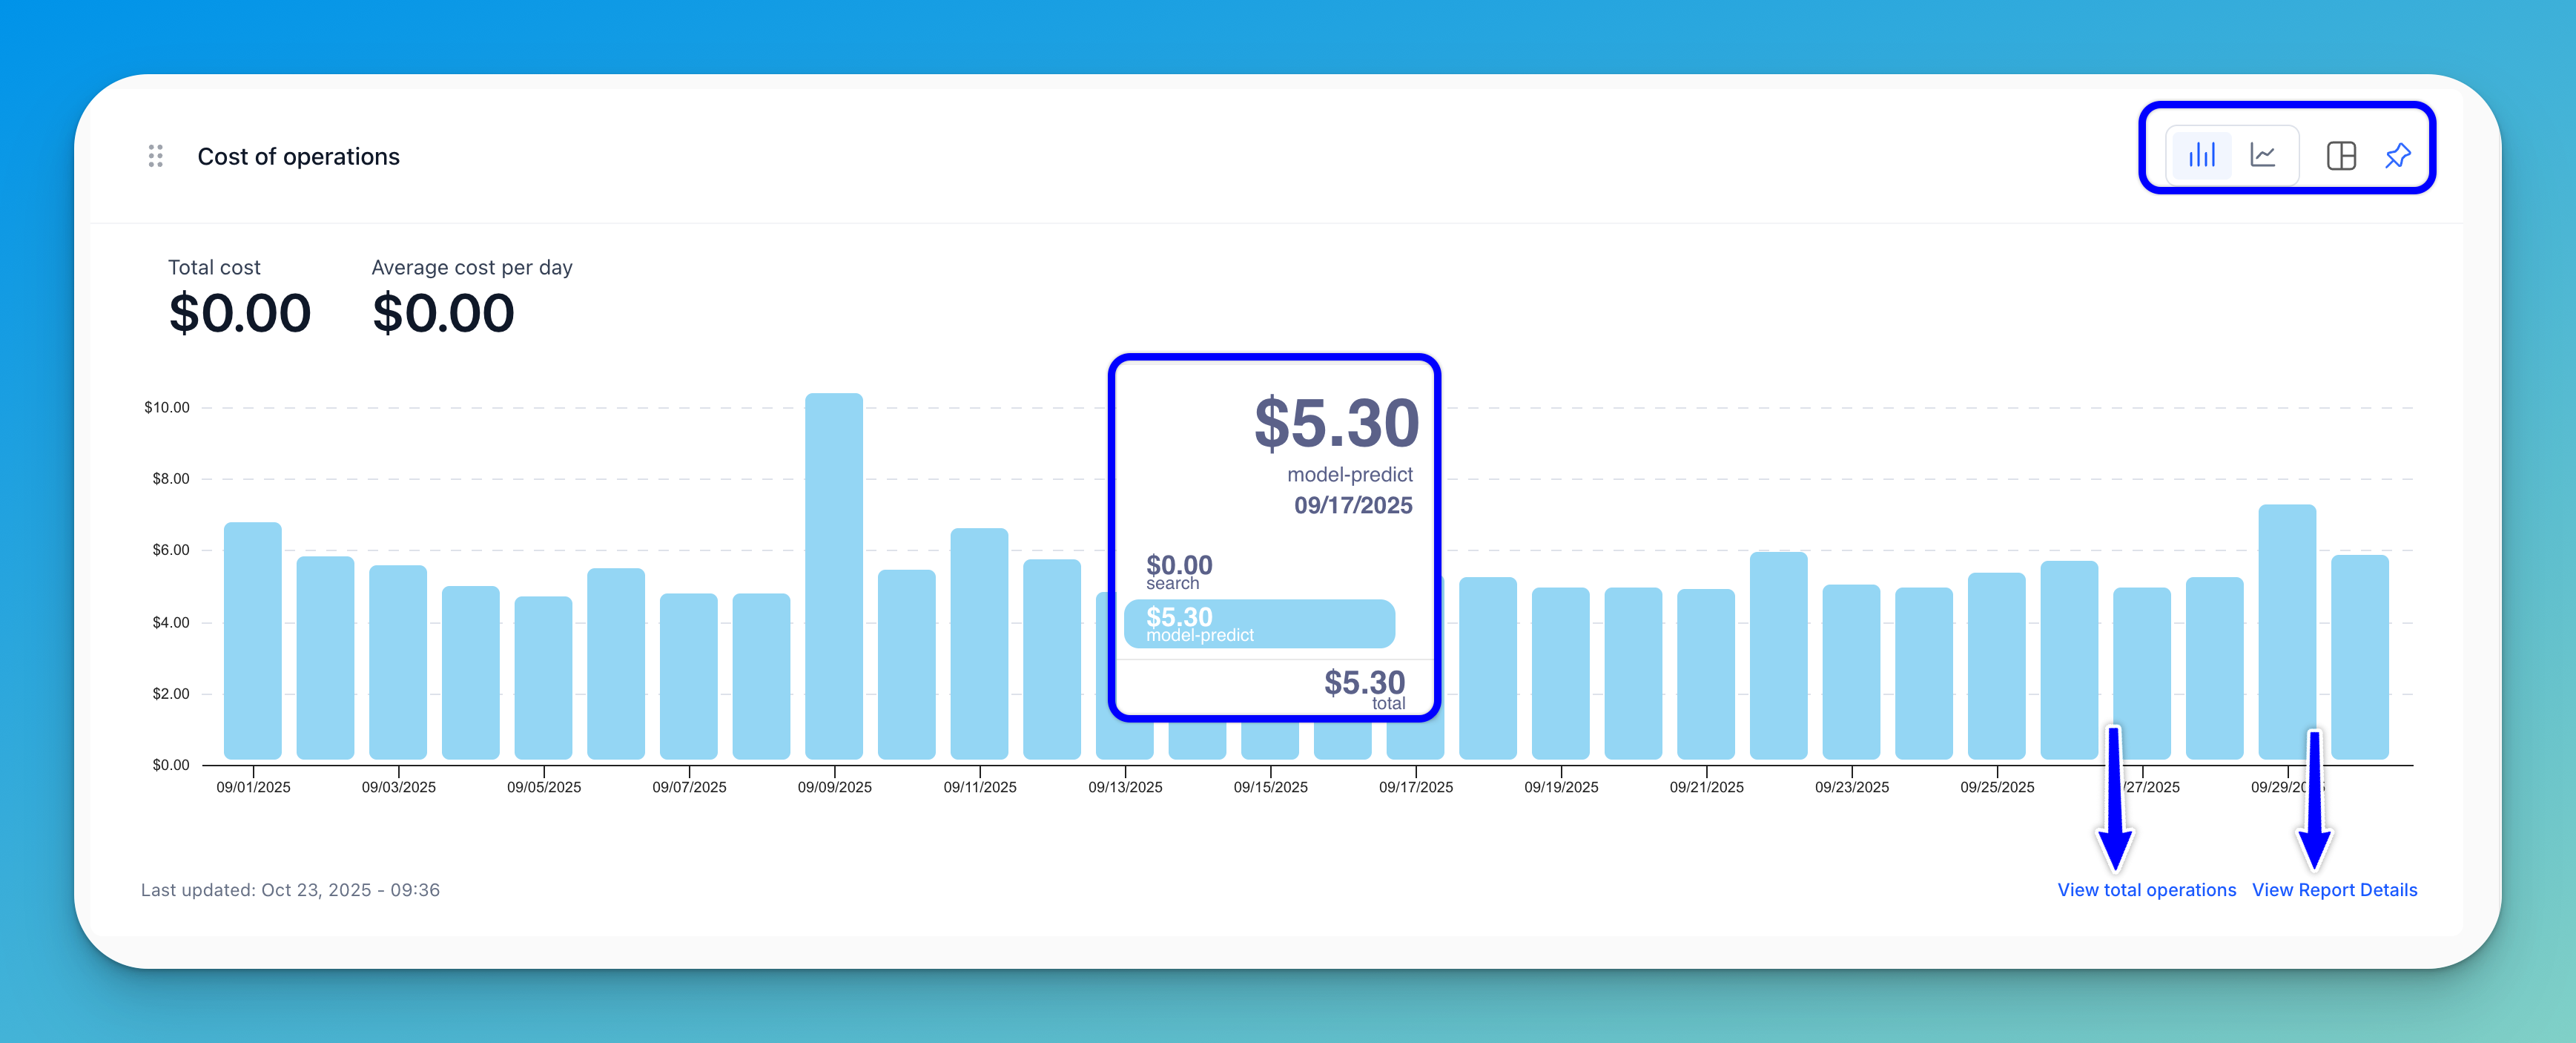
Note: The charts in the Costs & Budget tab are linked to related charts in the Usage & Operations tab, and vice versa. These cross-navigation links allow you to seamlessly explore related insights. For example, the Cost of Operations chart includes a link in the lower-right corner that directs you to the corresponding Total Number Operations chart.
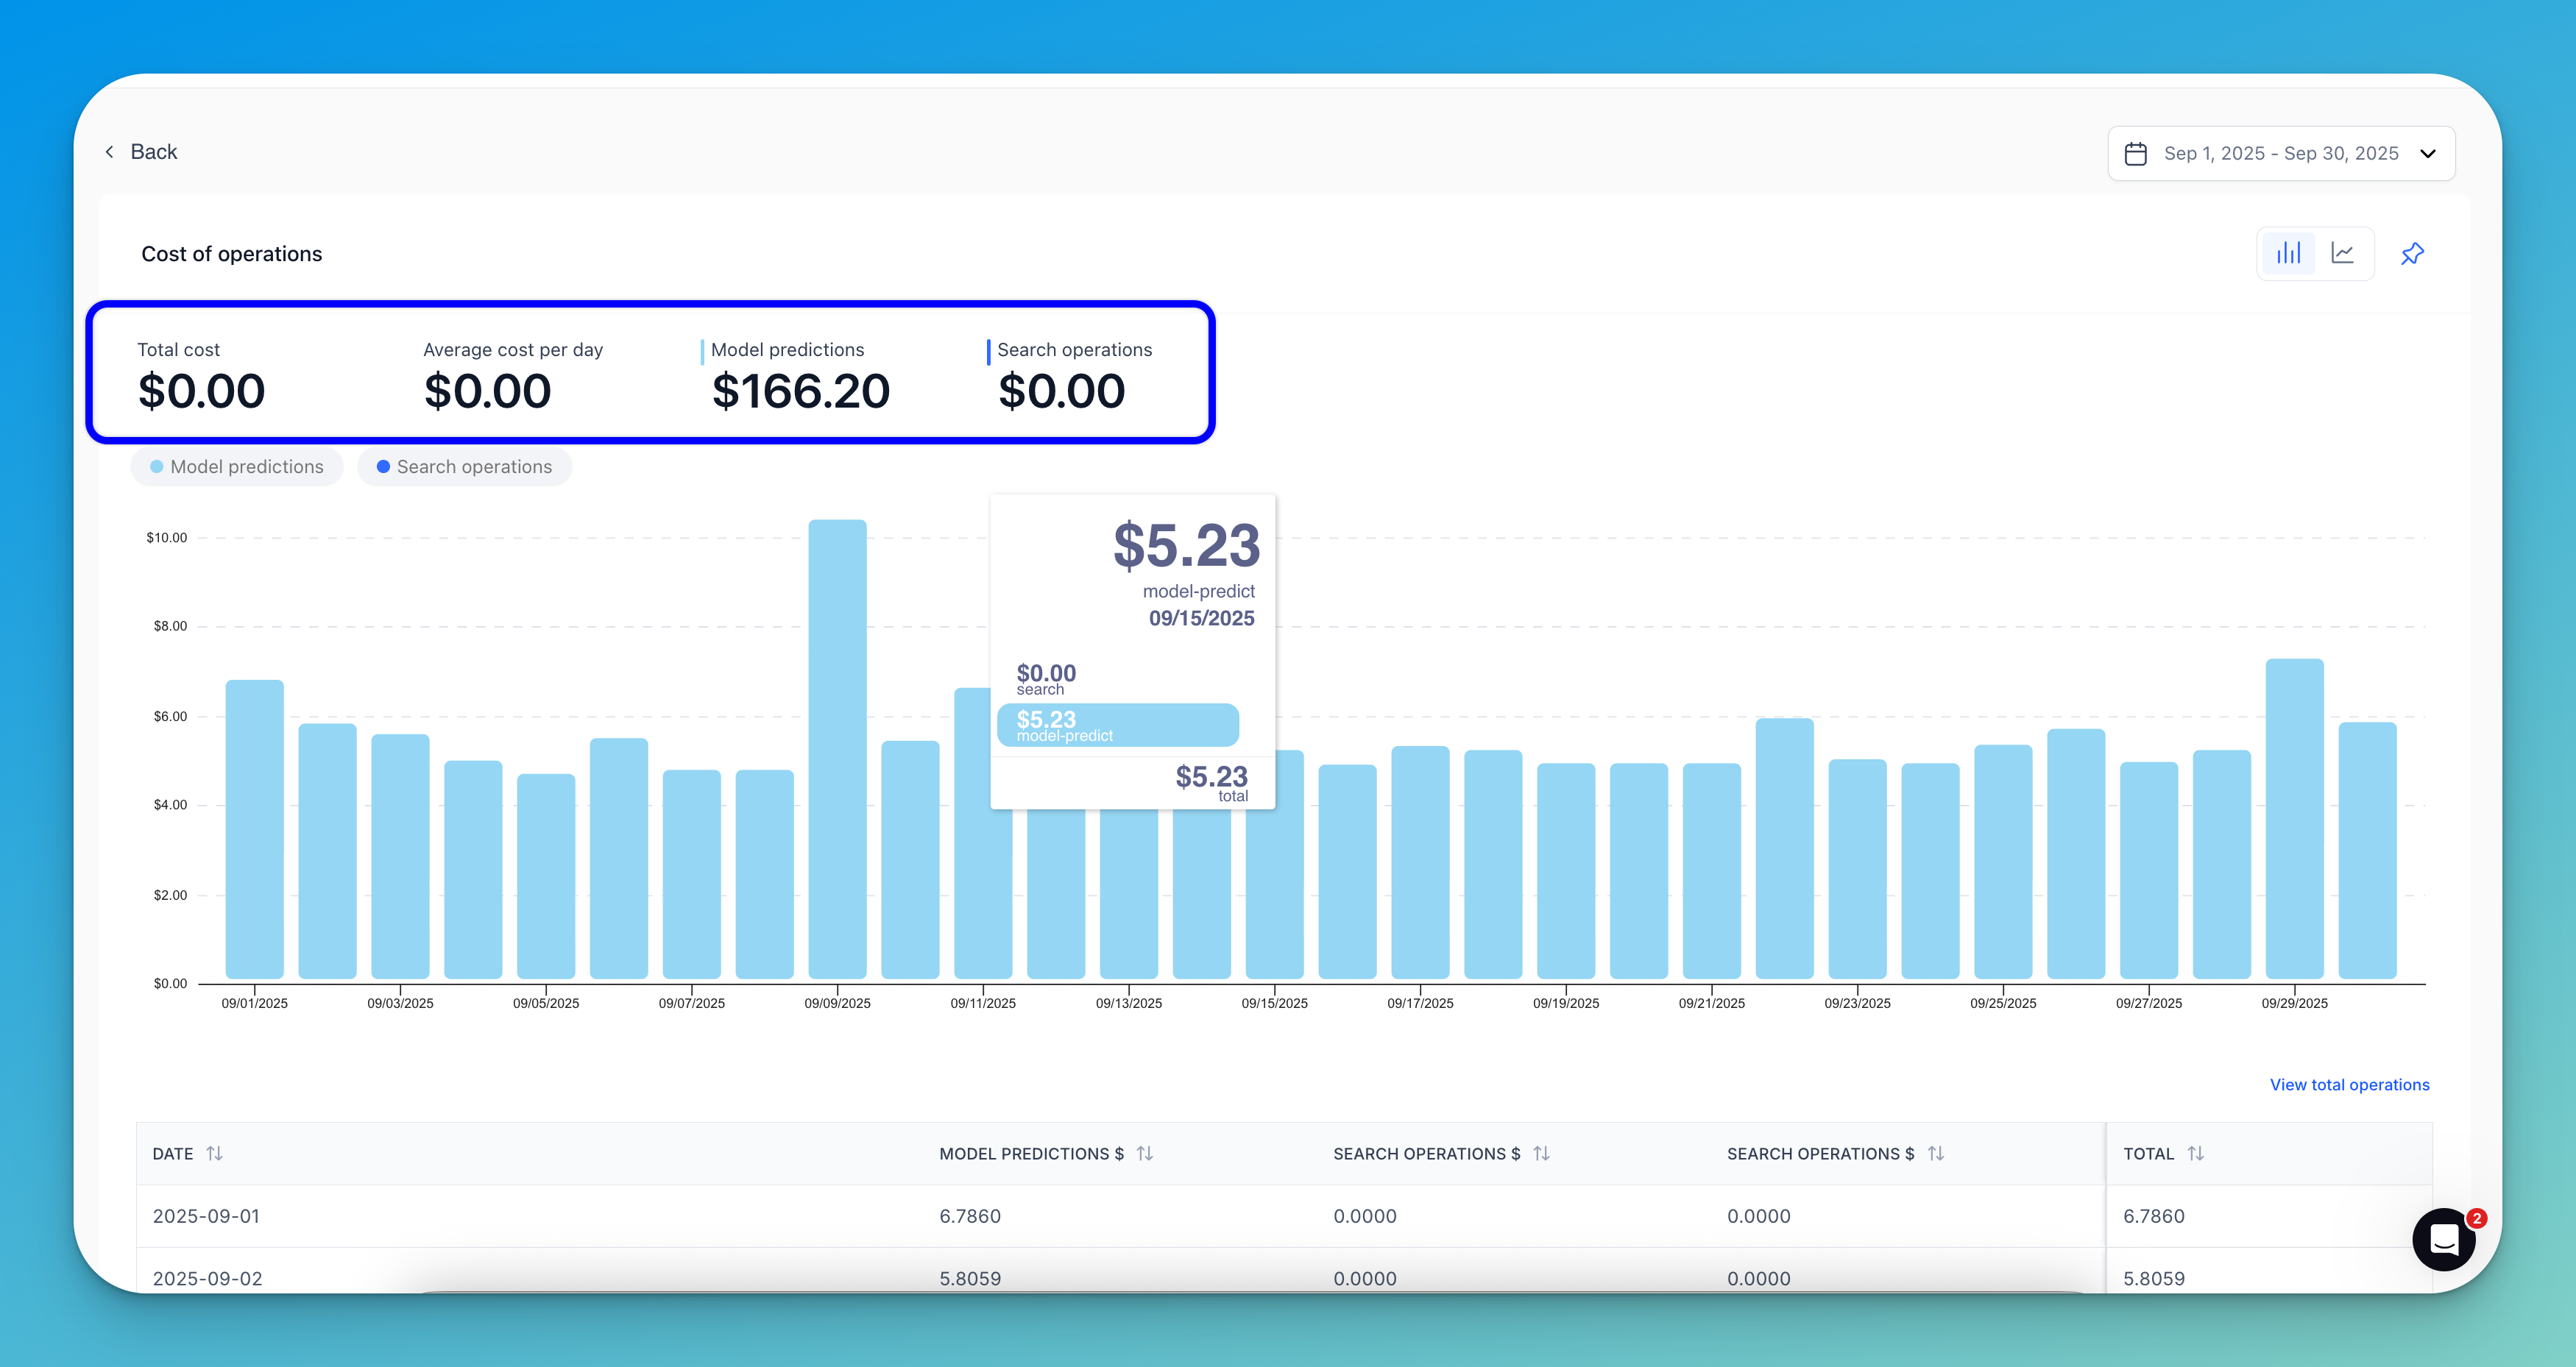
If you click the View Report Details button in the lower-right corner of a chart, you’ll be redirected to a detailed report page.
Here, you'll find a comprehensive breakdown of each cost type for the selected period, with options to filter charts by specific costs. The page also includes a table that displays the date each expense was incurred, along with other detailed insights.
Learn more about using these chart features here.
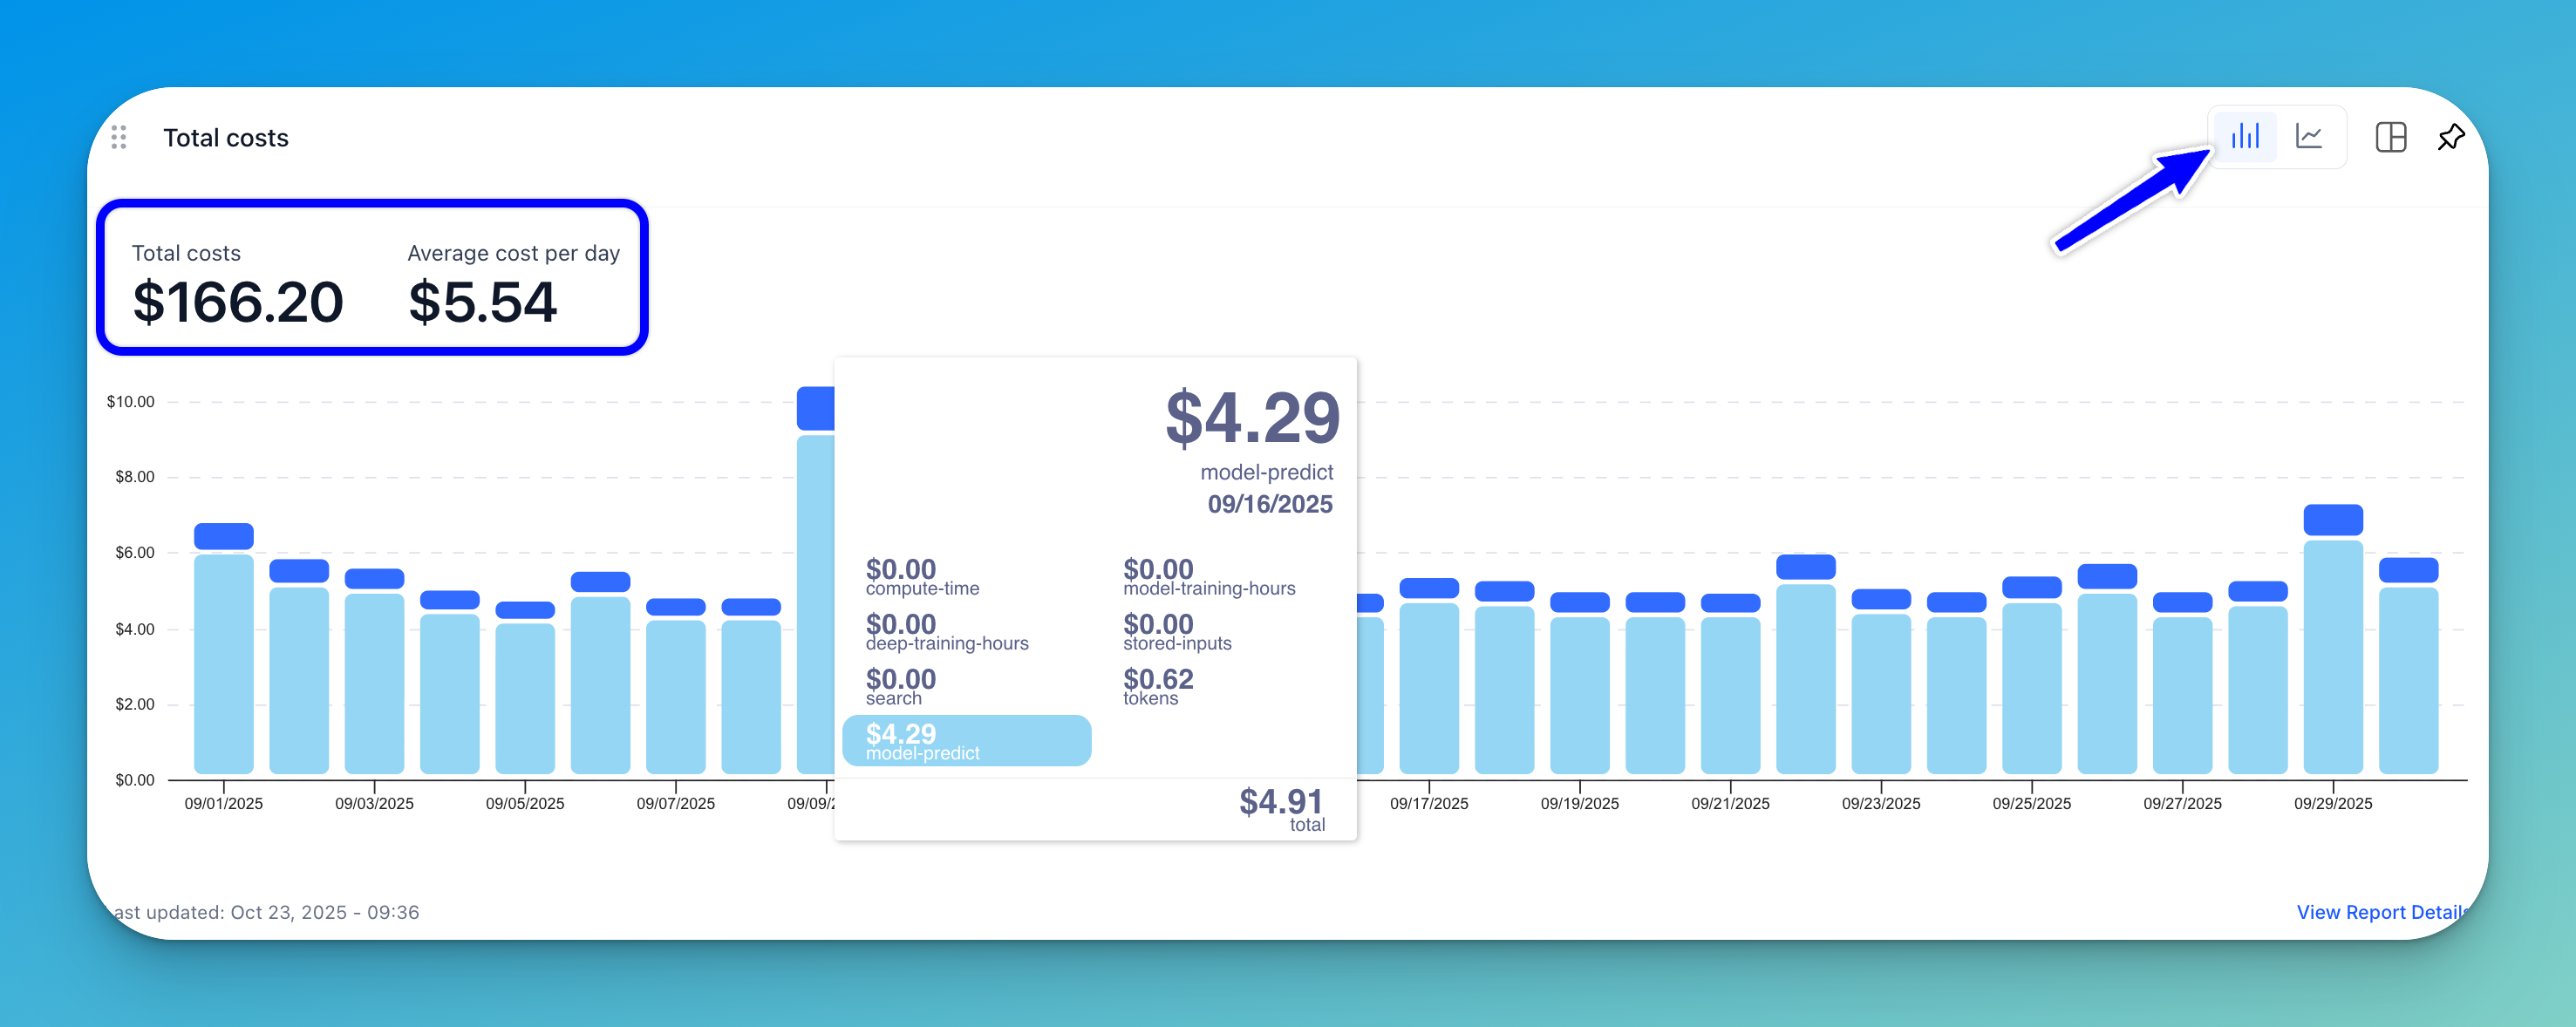
Total Costs
This section displays the total cost of all your billable operations, along with the average daily cost, during the selected time period.
It helps you track spending across each operation.
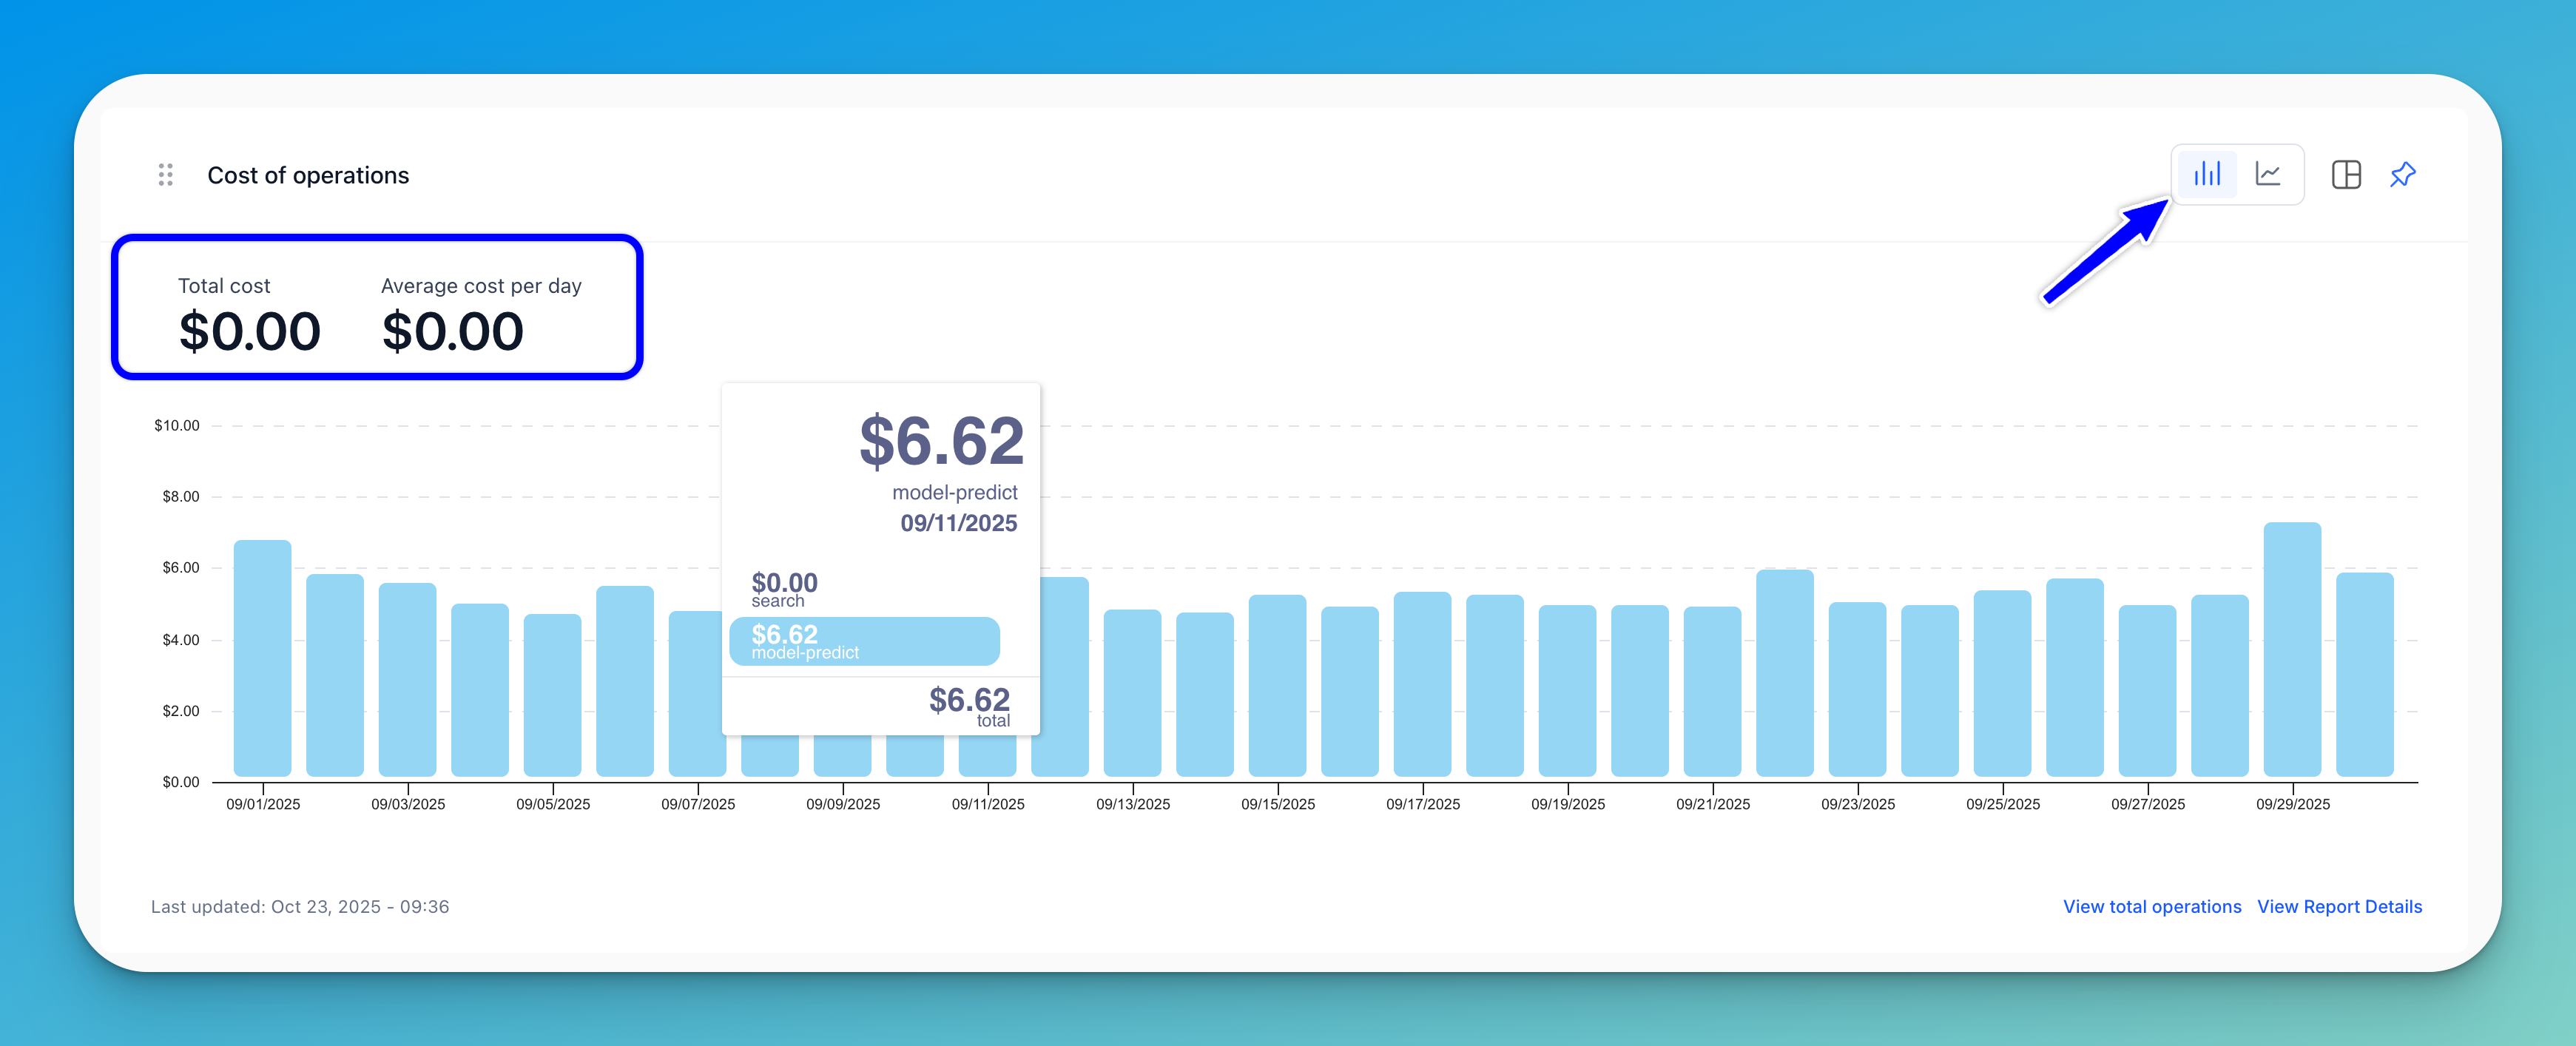
Cost of Operations
This section displays the total cost of all your operations, along with the average daily cost, during the selected time period.
It helps you track spending across your model predictions and search operations.
Models Cost by Type and Date
This section displays the total cost of all your model predictions, along with the average daily cost, during the selected time period.
It helps you track spending trends by model type across specific dates.

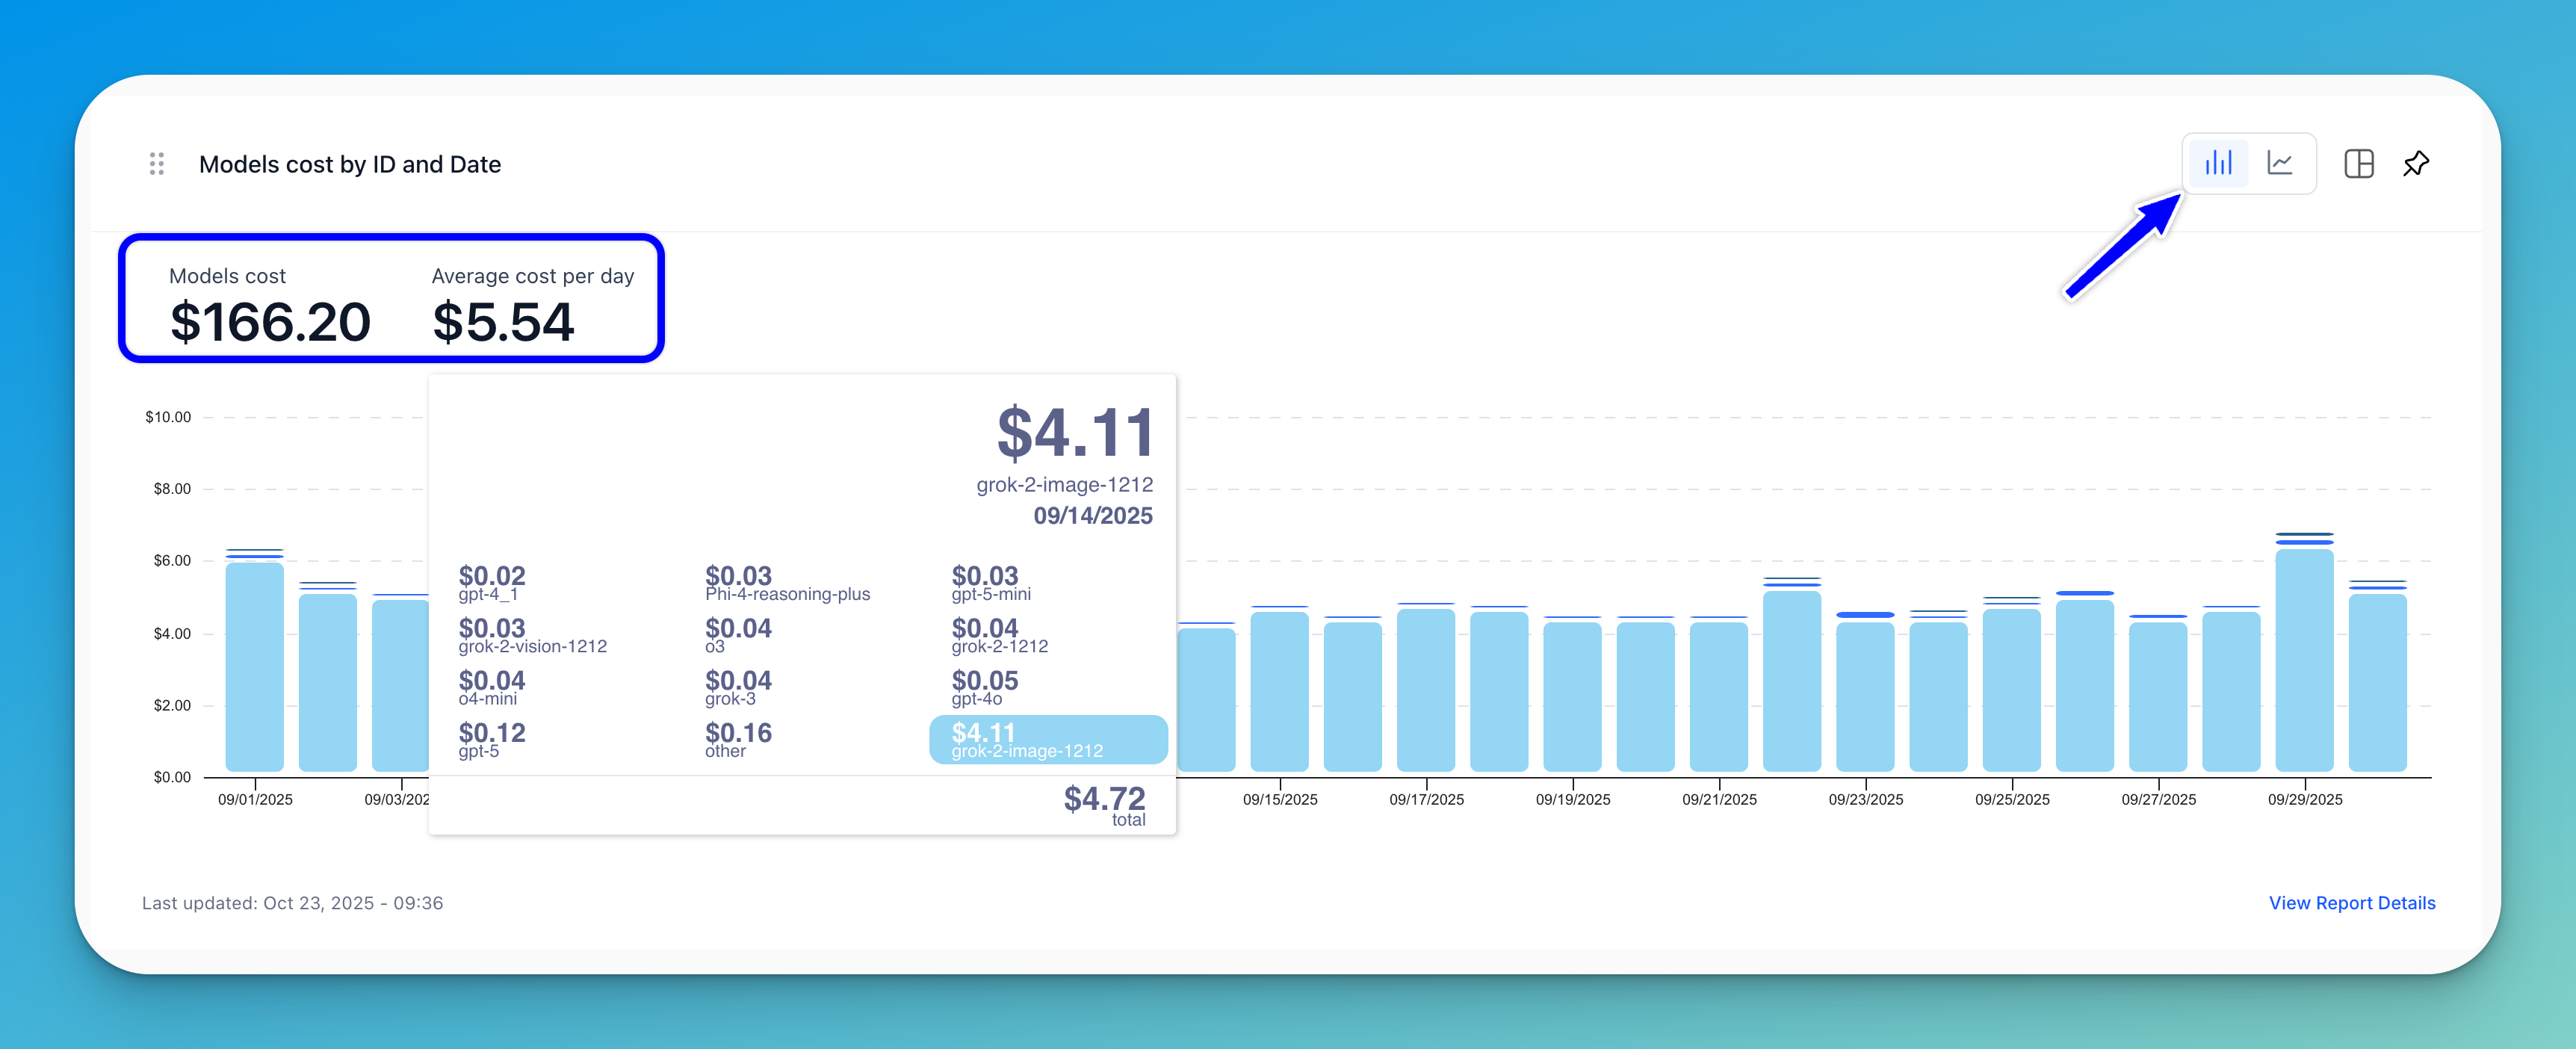
Models Cost by ID and Date
This section displays the total cost of all your model predictions, along with the average daily cost, during the selected time period.
It helps you track spending trends by model ID across specific dates.
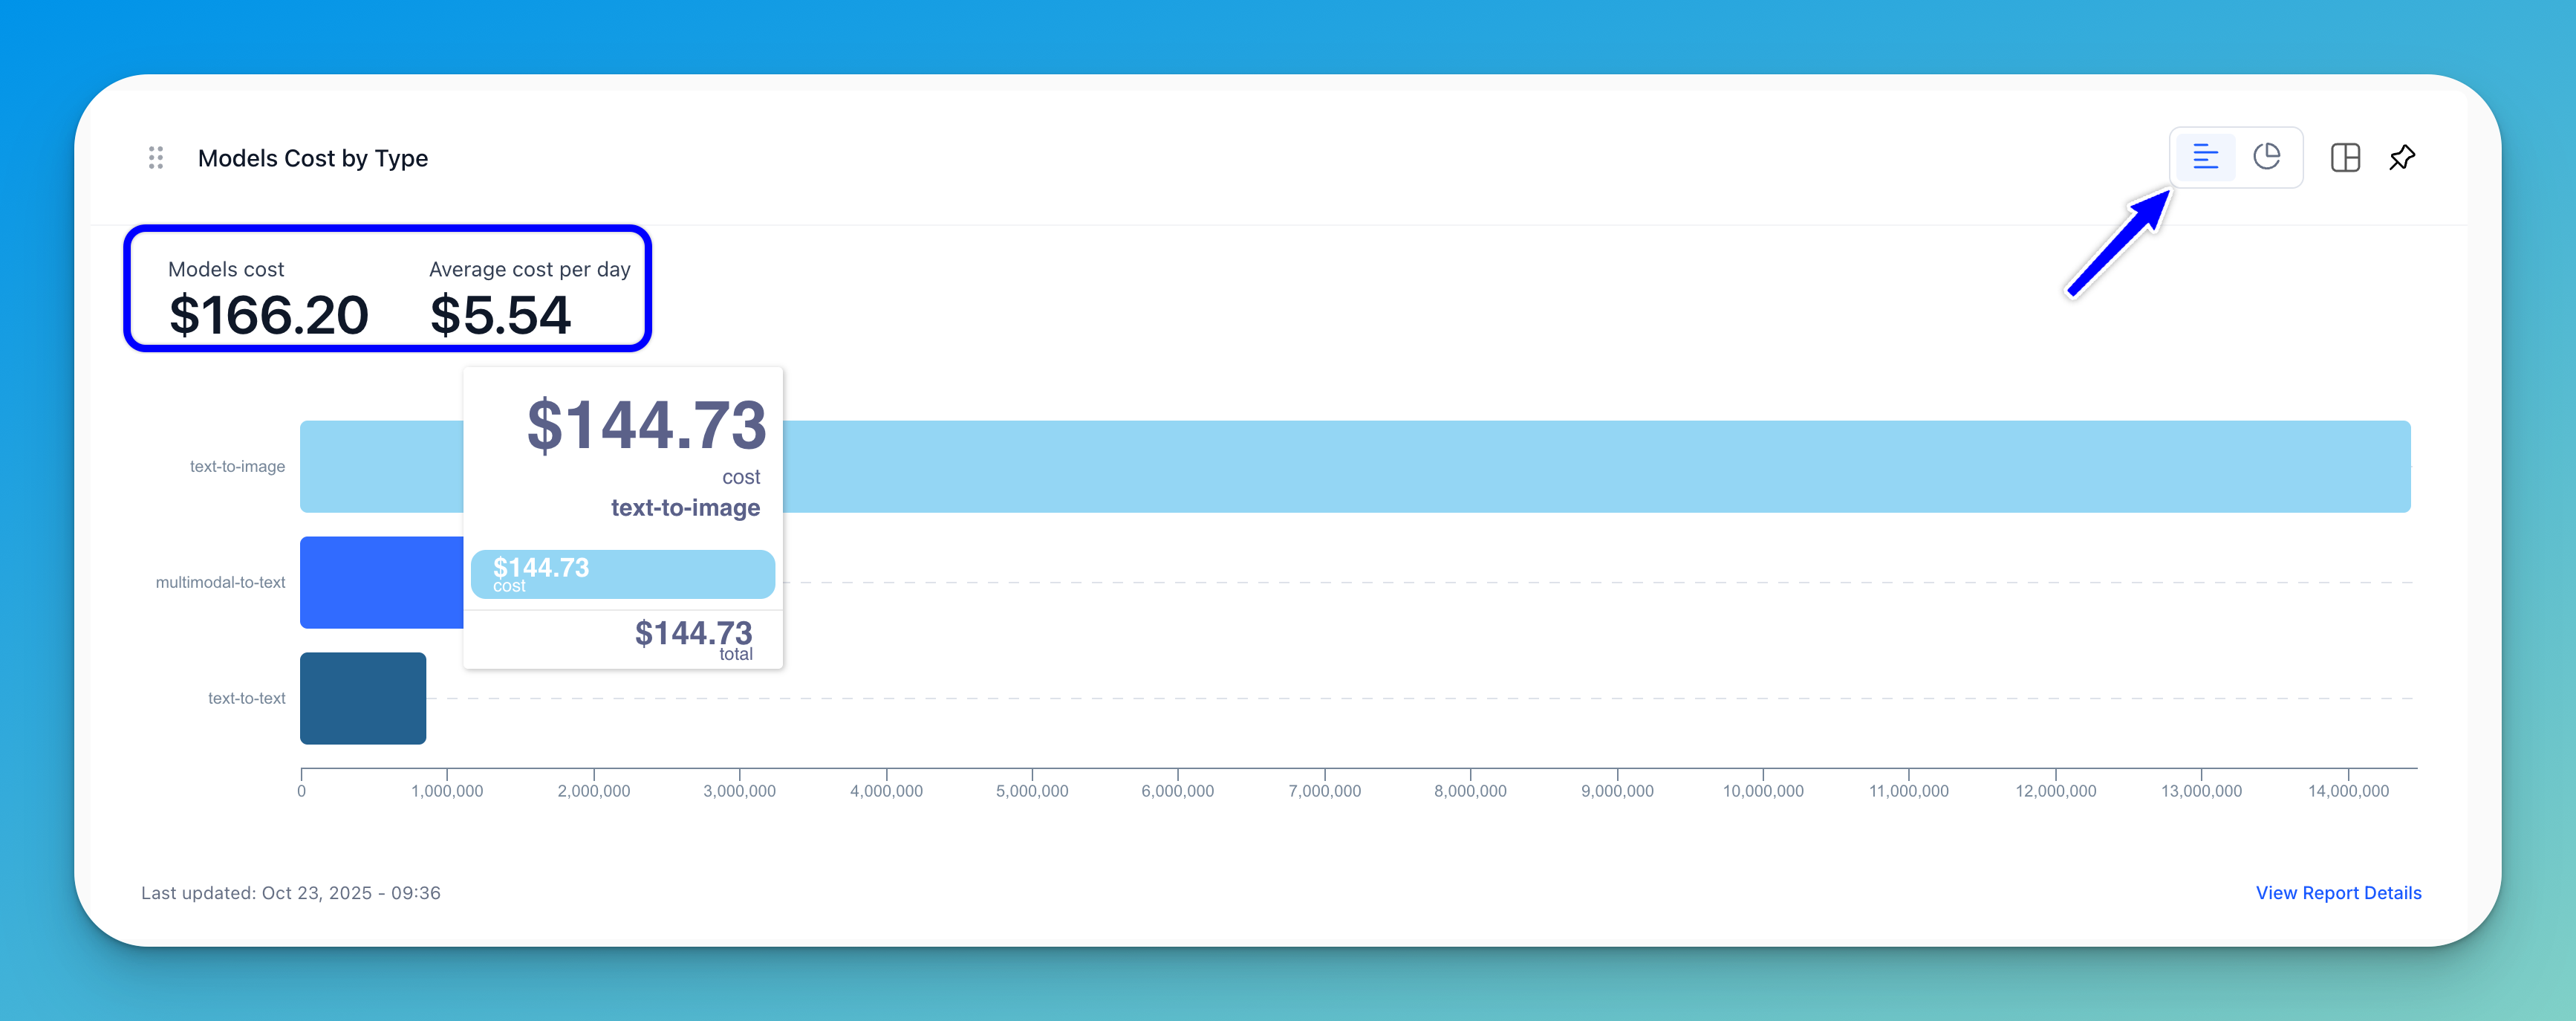
Models Cost by Type
This section displays the total cost of all your model predictions, along with the average daily cost, during the selected time period.
It helps you track spending across each model type.
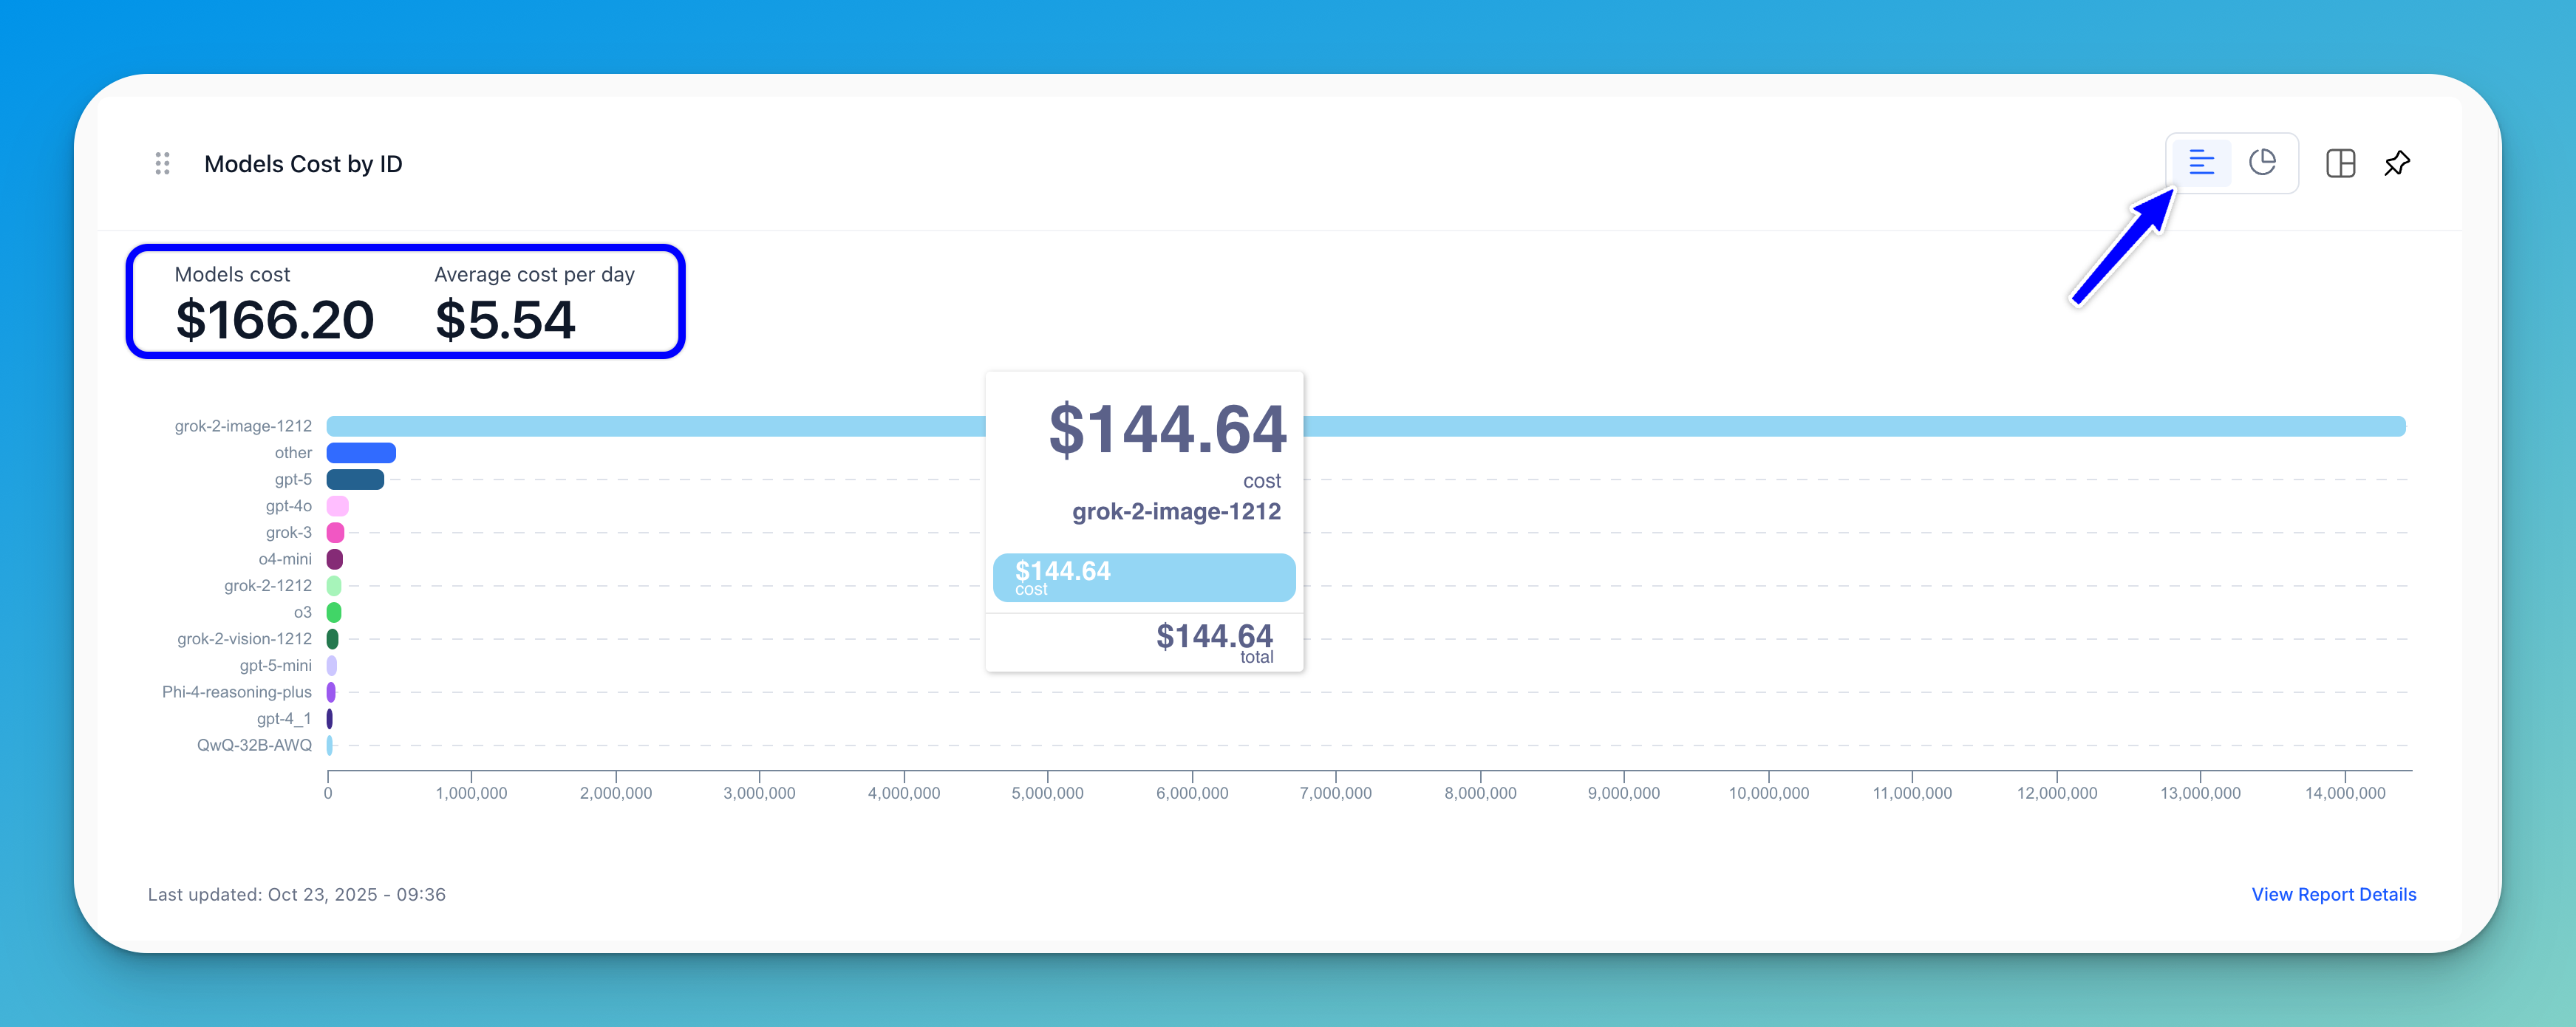
Models Cost by ID
This section displays the total cost of all your model predictions, along with the average daily cost, during the selected time period.
It helps you track spending across each model ID.
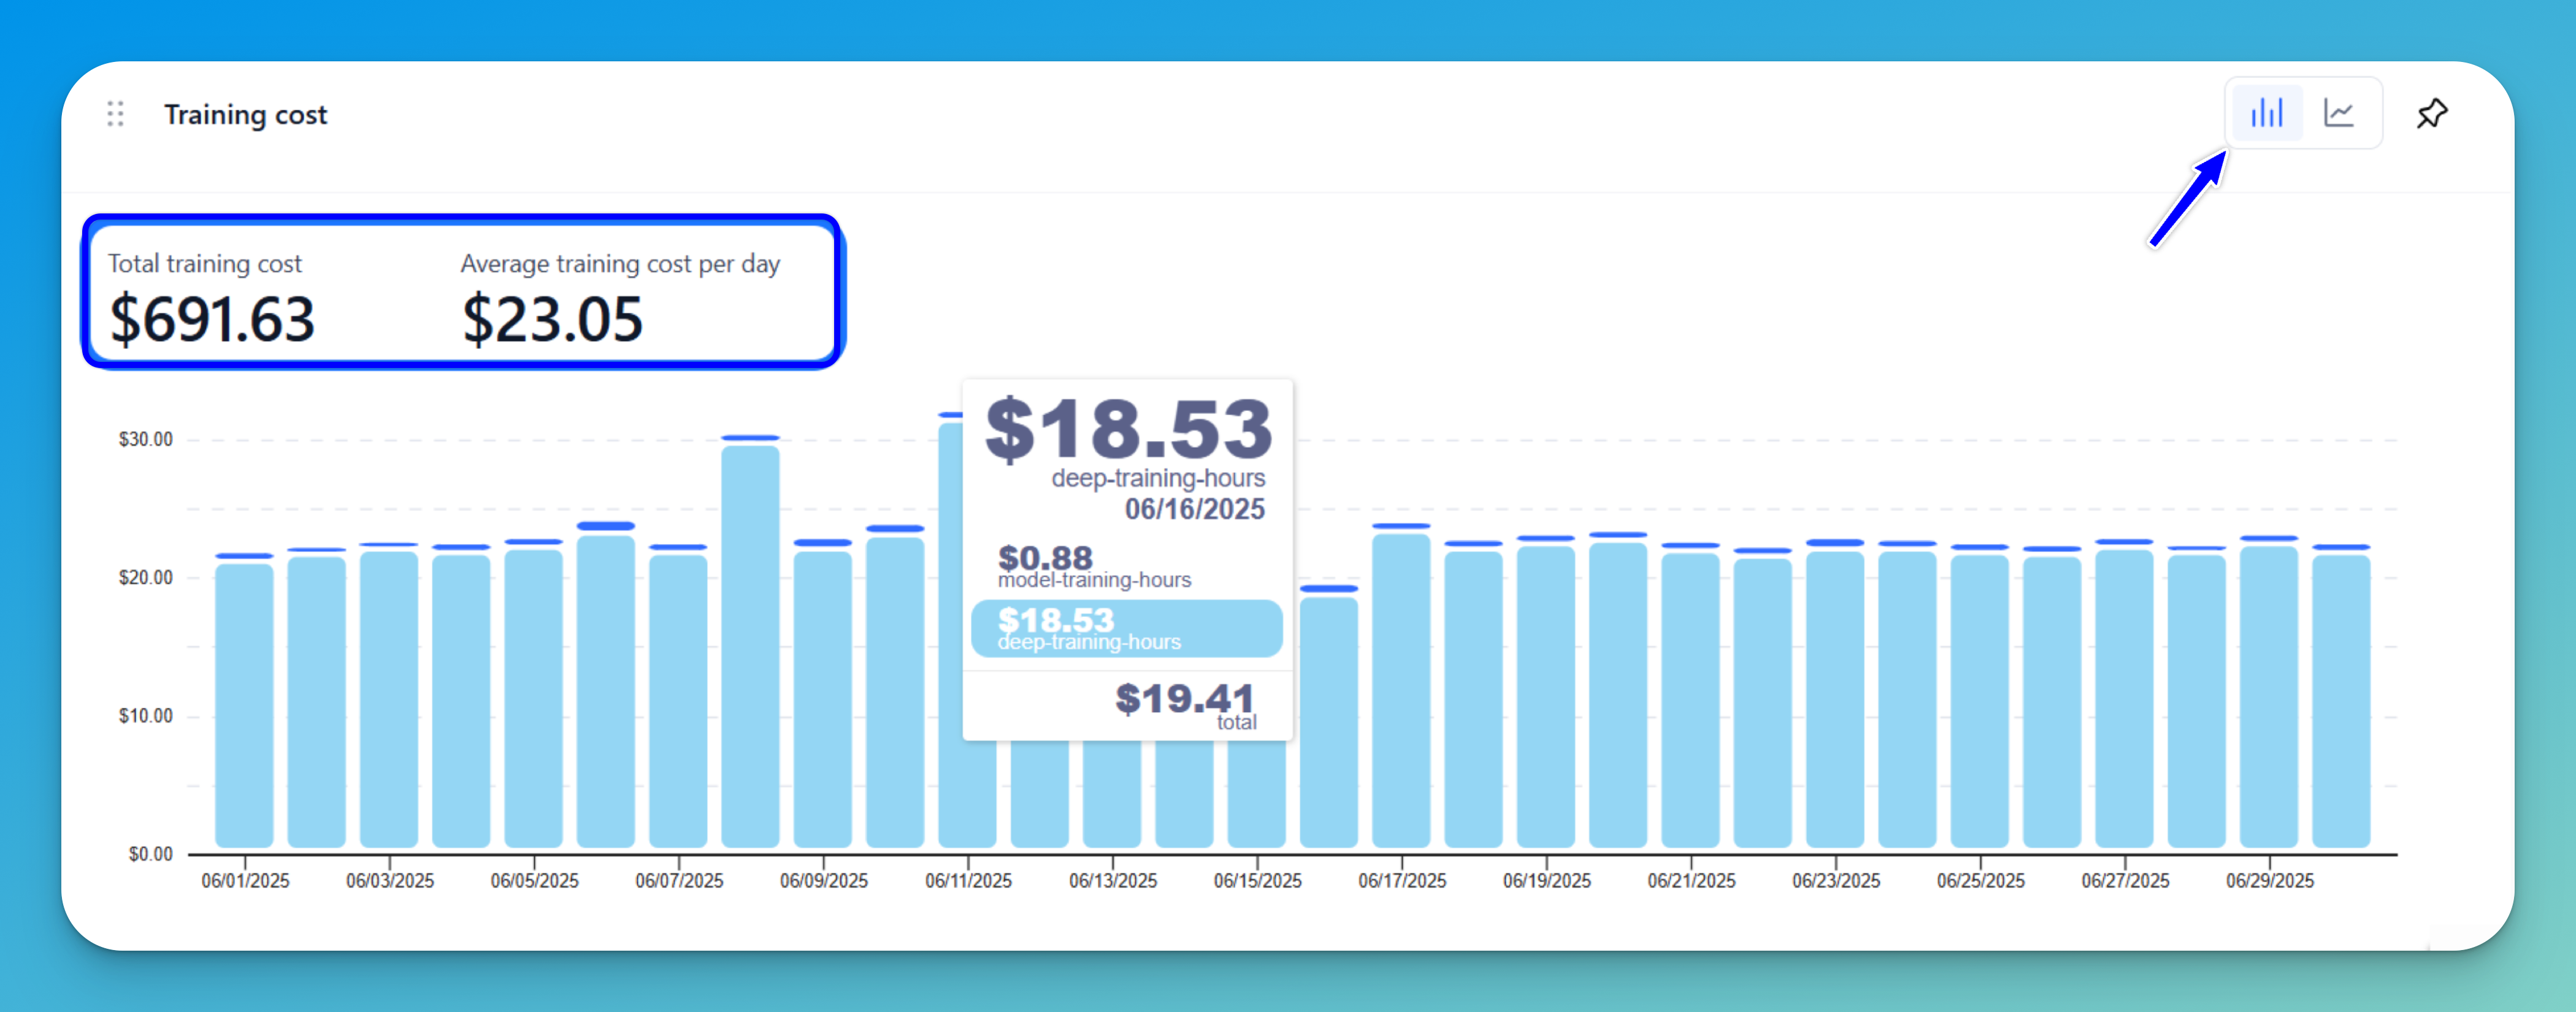
Training Cost
This section displays the total cost of training your deep training and transfer learning models, along with the average daily cost, during the selected time period.
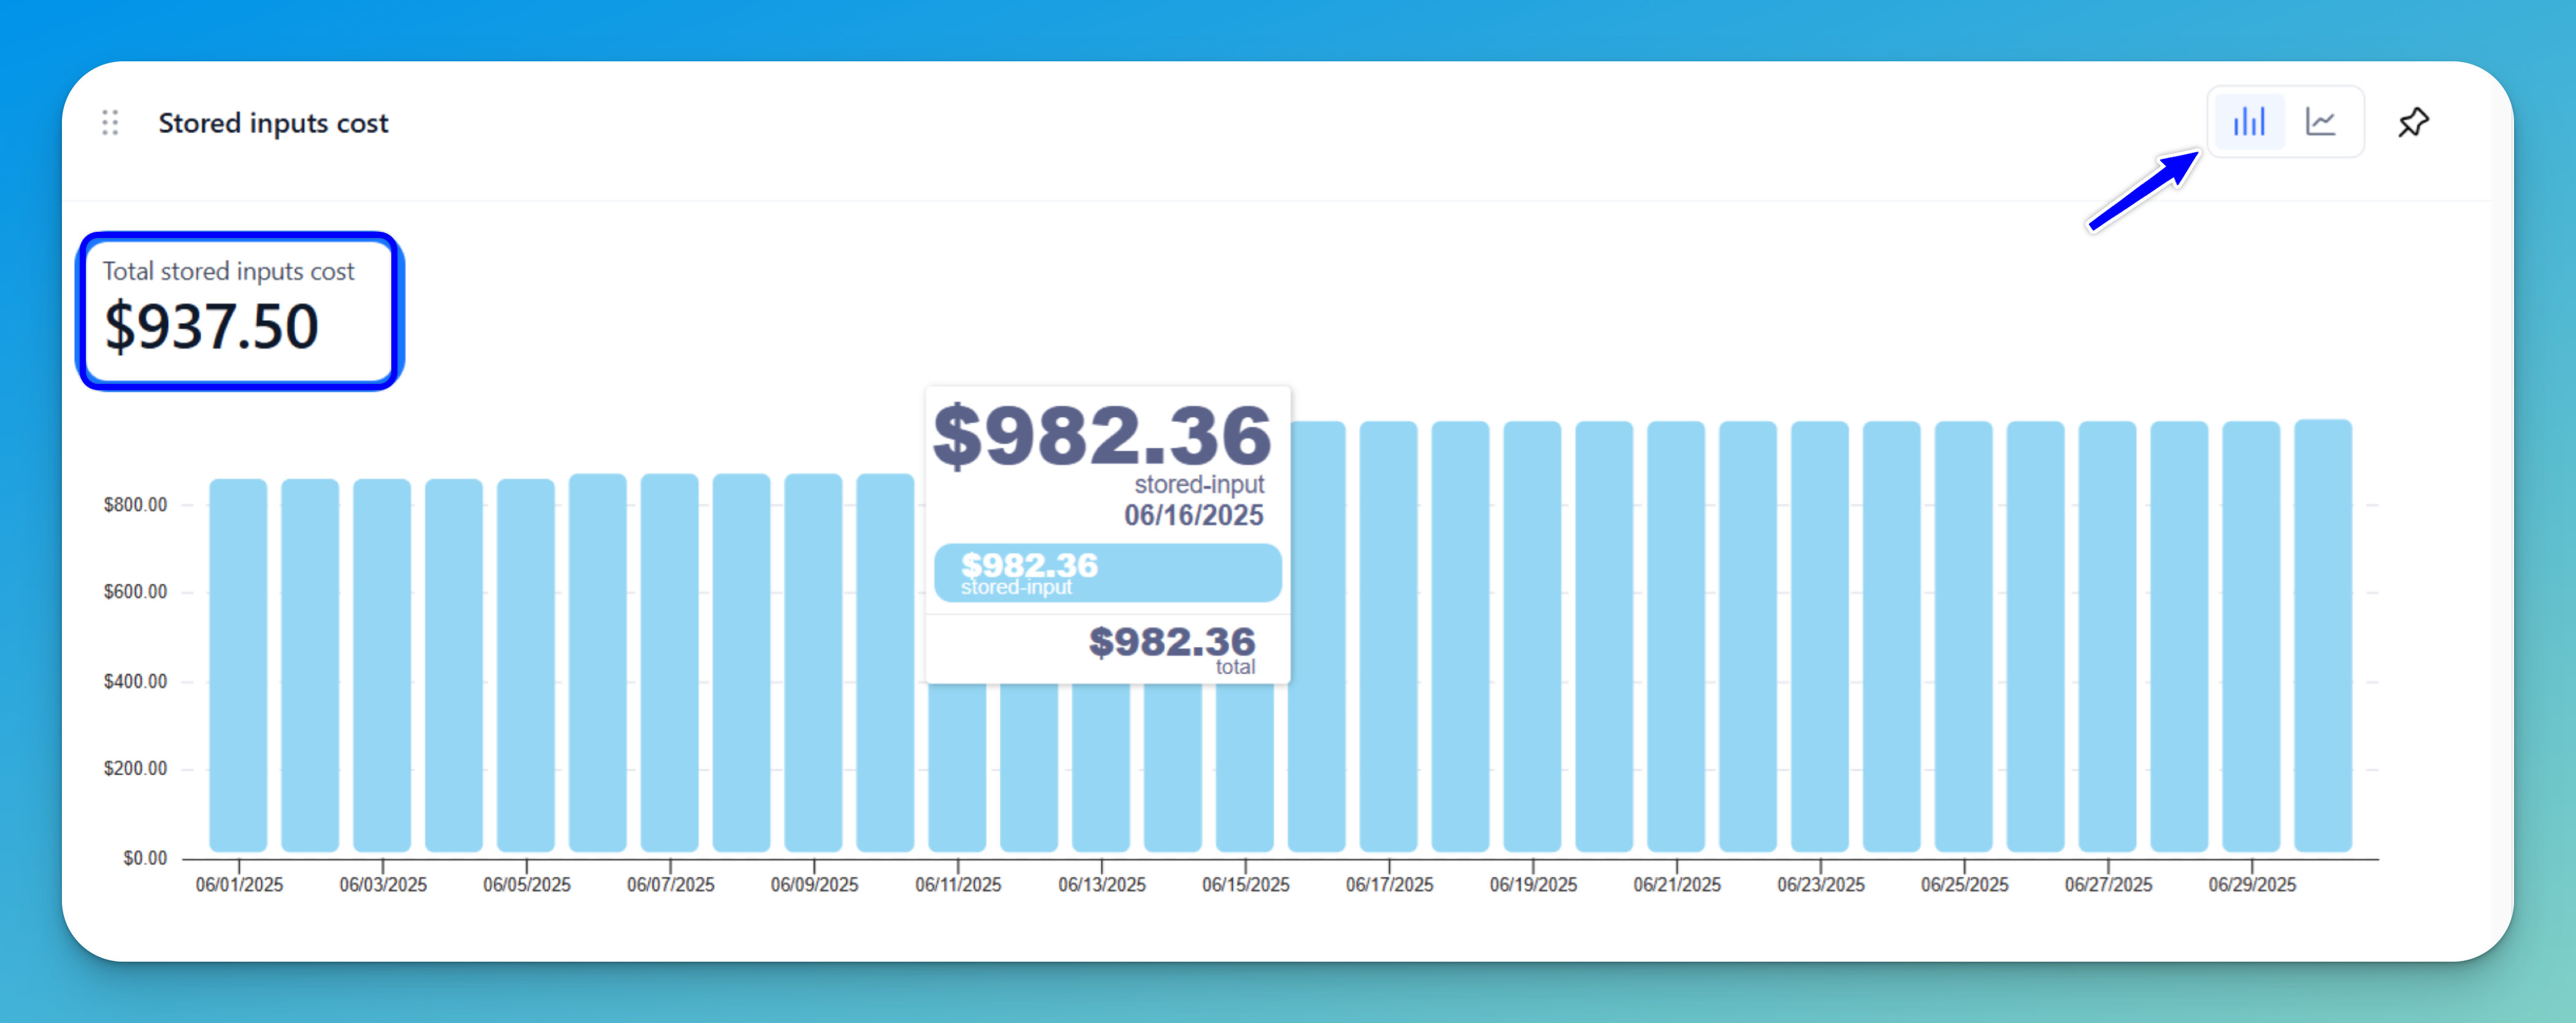
Stored Inputs Cost
This section displays the total cost of storing inputs on our platform during the selected time period.
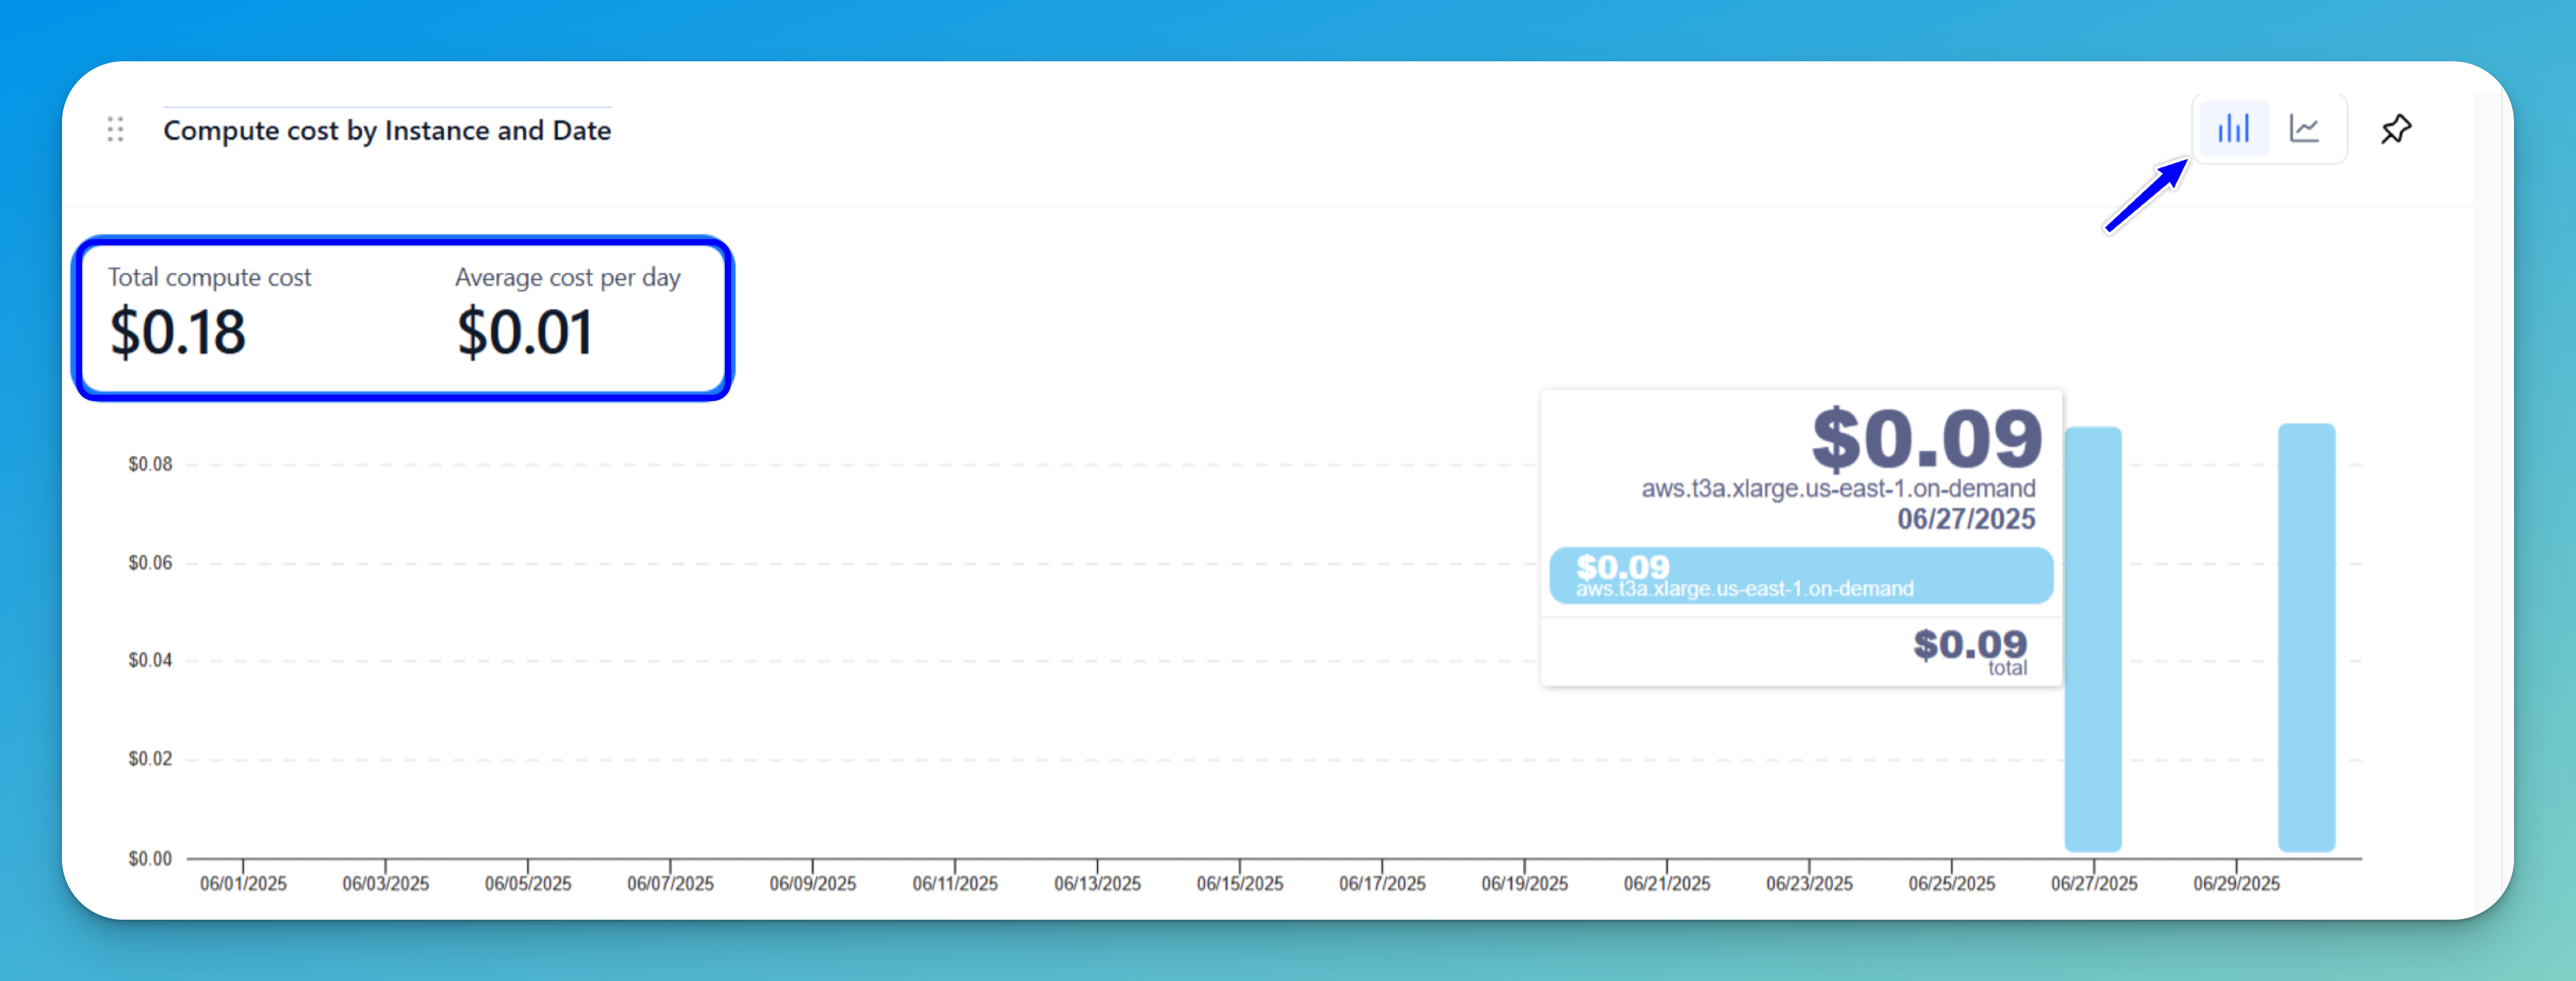
Compute Cost by Instance and Date
This section displays the total compute cost for instance types, as well as the average daily cost, during the selected time period.
It helps you track spending across each instance type.
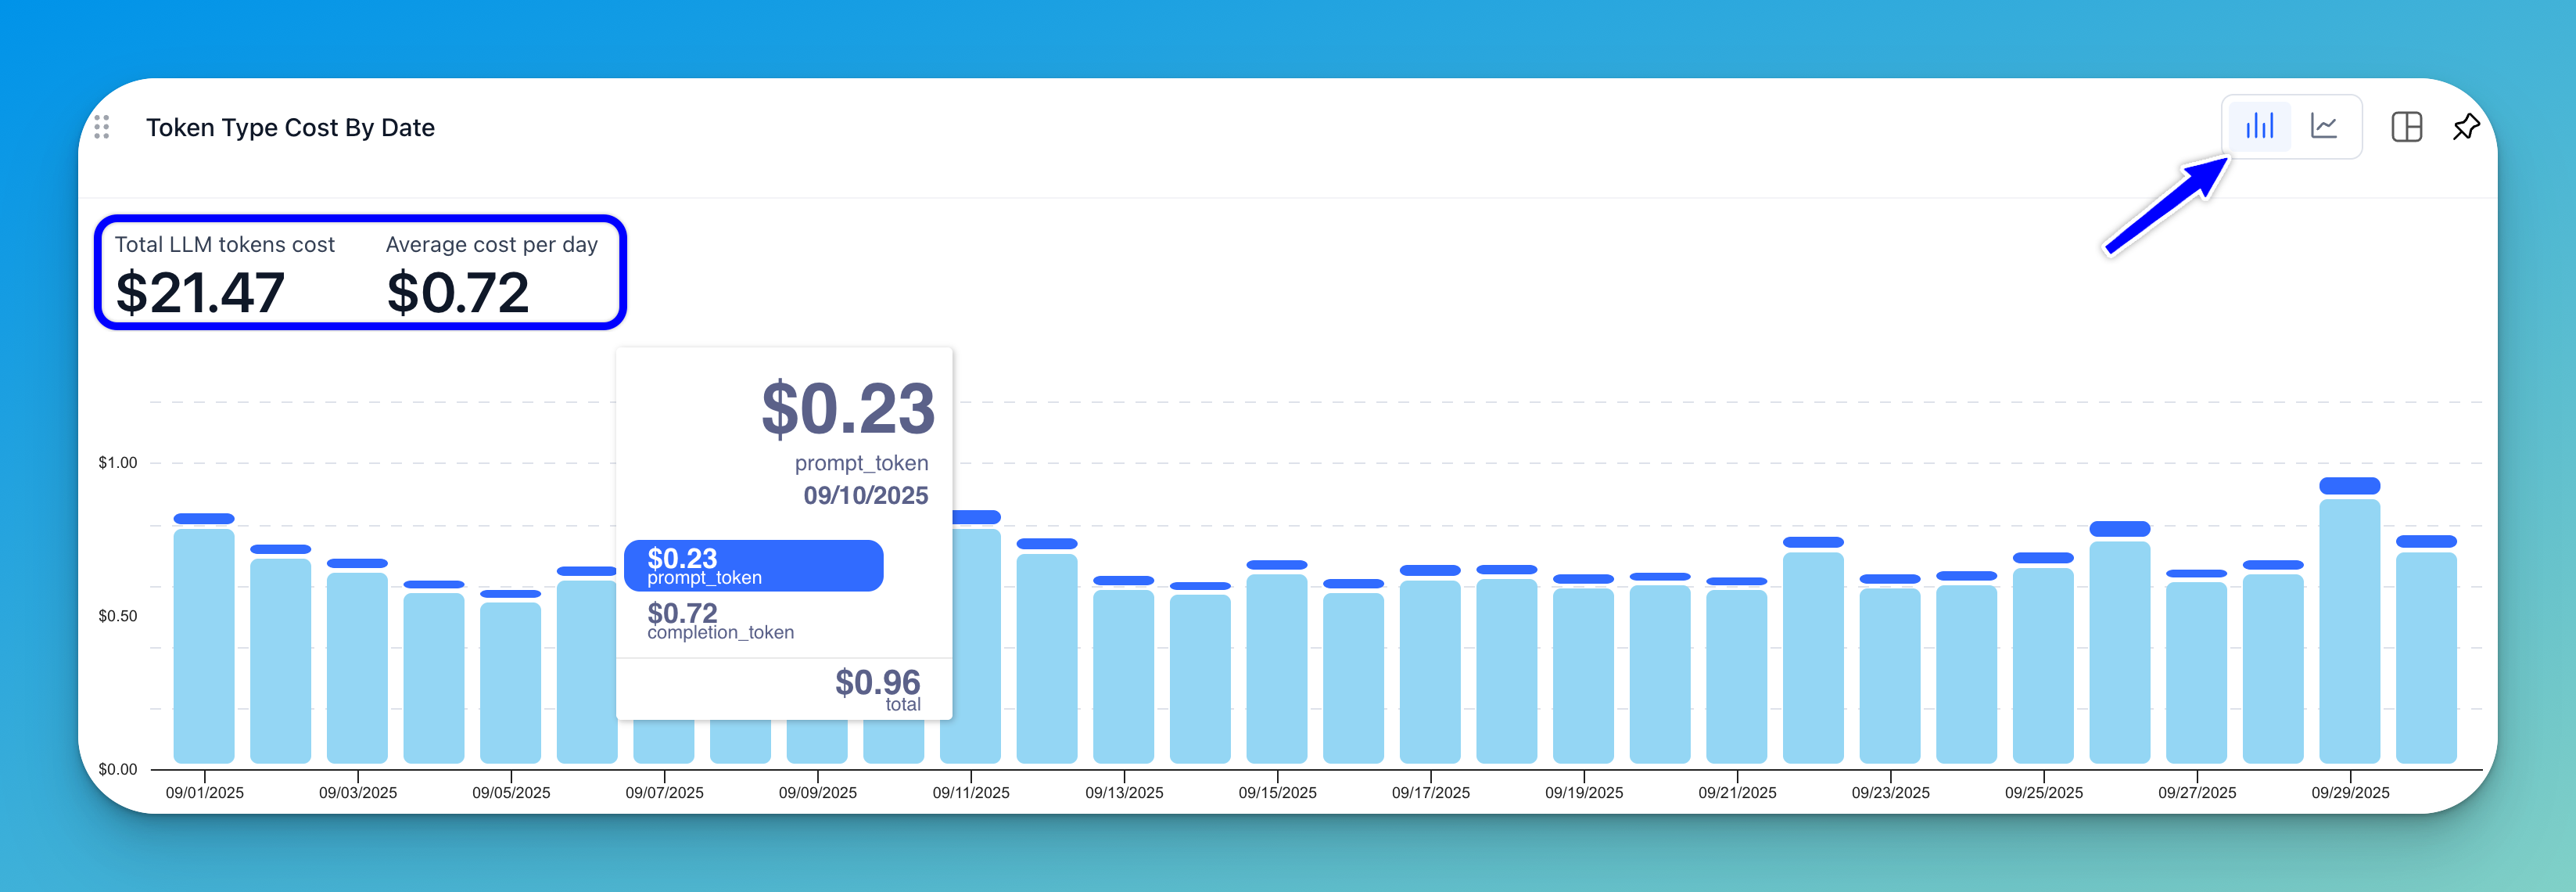
Token Type Cost By Date
This section displays the total cost of all your LLM tokens, along with the average daily cost, during the selected time period.
It helps you track spending trends by token type across specific dates.